
Change Curve
The 6 phases of a change process and how a trainer can positively influence it
Change Curve
The change curve illustrates a process of change. People go through different emotional phases during this process.
The Change Curve is based on the work of Swiss-American psychiatrist Elisabeth Kübler-Ross. In the 1960s, she explored the phases terminally ill patients experience and developed this model. Her goal was to help people (doctors, caregivers, family, and friends) better understand and respond to the needs of the terminally ill.
Much later, various authors adapted Kübler-Ross's model for the business context, further developing and adjusting it.
The Change Curve is a classic objection handling model. It predicts potential objections a customer or seminar participant might have. This model is particularly useful in selling seminars or during acquisition.
Below, the different phases are briefly explained in the seminar context.
Resistance
Change often initially triggers resistance in most people ("not me!"). They fear increased workload, stepping out of their comfort zone, and often feel uncertain. The first reflex is then opposition and rejection.
Crash
If people are not guided during the change process or are left alone, a crash can occur. This means the person increasingly resists the change, reducing the chance of accepting it.
Rock Bottom
The resistance phase eventually ends. People realize they can't stop the change. The curve reaches its lowest point. Now begins the phase of accepting change. The person opens up to the new. Ideally, this comes from intrinsic motivation, realizing the change will be positive. In the worst case, it comes from resignation. In this case, the trainer must support the person, extrinsically motivate them, and guide them towards improvement.
Ascent
Once the change process starts, the ascent begins. It's important for the person to stay open to changes. They realize they will grow from them and can broaden their perspective.
Next Level
In the next step, people learn to handle the change. They engage deeply with it. This causes the curve to rise to its peak.
The peak of the curve is above the starting point. The intended benefit is achieved. Seminar participants have embraced the change and are ready to learn something new.
Bridge
A trainer ensures the crash isn't too deep. They build a metaphorical bridge. This helps participants accept the change faster and more easily. Resistance is stopped right at the start, preventing them from entering the crash phase. The trainer guides them over the bridge directly into the next level phase.
Example Using the Graphic
A company's management has purchased new software. The change meets resistance from most employees. This might manifest as:
- "Why something new? The old software always worked well."
- "I'm too old to get used to new software now."
- "I don't want to learn something new!"
- "...."
Since management didn't consider how employees might react, they are left alone with their thoughts and emotions about adapting to new software. Resistance grows, and employees enter the crash phase. During this phase, the company loses money (in the graphic, €50,000) because the new investment isn't yet utilized.
Eventually, the rock bottom is reached. This is the turning point. Employees realize resistance won't help. The change process can now begin. Employees open up to the new software and engage with it.
In the ascent phase, the company starts to slowly make profits again (in the graphic, €100,000).
In the next level phase, the change process is complete. Employees are familiar with the new software and can work economically with it.
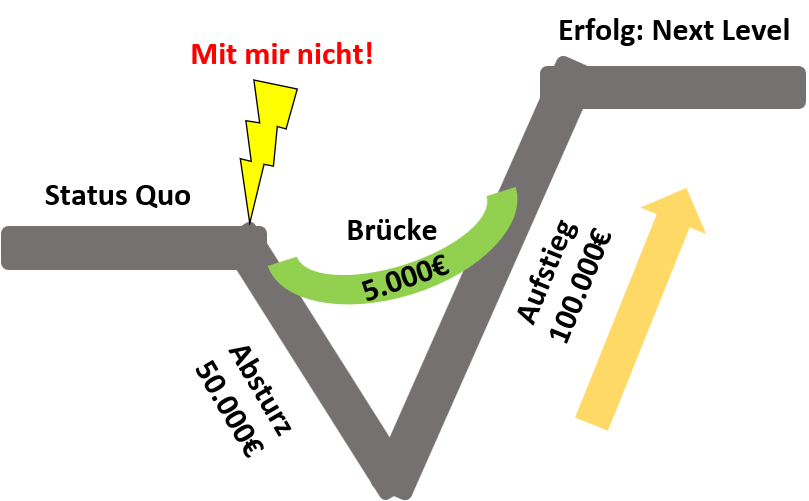
Example Using the Bridge
To avoid the crash and rock bottom phases and thus prevent losses, management thought carefully about how employees might react before purchasing the new software (objection handling). They hired a trainer to guide employees through the bridge phase.
This trainer prevents major resistance and helps employees mentally and technically adjust to the new software. As a result, the company incurs less loss (in the graphic, €5,000) and can quickly work economically with the new software.